Ichimoku Kinko Hyo (Ichimoku Clouds, Ichimoku Kinko Hyo), also known as Ichimoku Kinko Hyo, is a multifunctional technical indicator invented by Japanese Ichimoku Sanjin (real name: Hosoda Goichi) before World War II. Through the relative positions between the parameters of this indicator, it is possible to quickly determine the market trend, support and resistance levels, and find buy and sell signals. This article will introduce the structure of Ichimoku Kinko Hyo and how to read the chart.
Composition of Ichimoku Kinko Hyo
Ichimoku Kinko Hyo needs to set the calculation period to represent short (one and a half weeks), medium (one month), and long (two months). In the 1930s, Japan had 6 working days per week, so the traditionally more commonly used parameters are 9, 26, and 52, which are also the default values of most systems.
As the times change, today's society has 5 working days a week, and some people have suggested that it should be adjusted to 7, 22, 44 or 8, 22, 44.
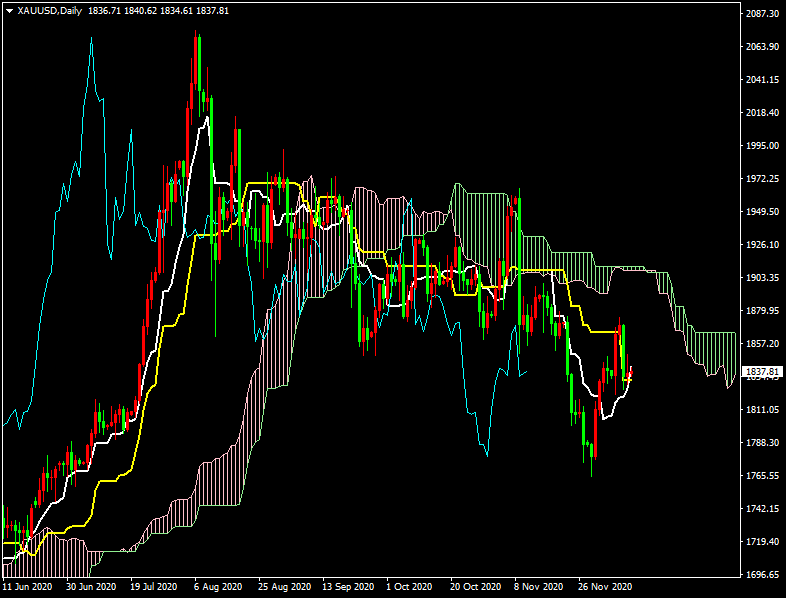
Figure 1: Ichimoku Kinko Hyo on the daily gold chart, with red lines indicating increases and green lines indicating decreases
As shown in Figure 1, the Ichimoku Kinko Hyo includes five sets of parameters, namely the conversion line (white line), baseline (yellow line), chikan line (blue line), leading band A (red line), and leading band B (green line). The calculation method is based on the high and low points of different time periods. Taking the commonly used parameters (9, 26, 52) as an example, the calculation method is as follows:
- Conversion line (white line), also known as short-term express line (Tenkan-Sen / Conversion Line) = (highest price in 9 periods + lowest price in 9 periods) / 2, with 9 periods as a short-term cycle.
- Baseline (yellow line), also known as the central axis slow line or hub line (Kijun-Sen / Base Line) = (highest price in 26 periods + lowest price in 26 periods) / 2, with 26 periods as a central line period.
- The extension line (blue line), also known as the Chinkou Span / Lagging Span, the backward indicator (Lagging Band) = move the closing price of this period back to one mid-line calculation period (26 periods).
- Leading Span A (red line), also known as Leading Span A (Senkou Span A / Leading Span A) = (Conversion Line + Baseline) /2, moved forward to one midline calculation period.
- Leading Span B (green line), also known as Leading Span B (Senkou Span B / Leading Span B) = (52-period highest price + 52-period lowest price) / 2, moved forward by one midline calculation period.
- Cloud layer, also known as cloud band (Kumo / Cloud) = the area between the leading band A and the leading band B.
How to read the Ichimoku Kinko Hyo?
Although the Ichimoku Kinko Hyo has many parameters and may seem complicated at first, if you deeply understand the relationship between each parameter and price (K-line) and organize the information obtained, you will be able to see the price trend at a glance. We will split the Ichimoku Kinko Hyo into three parts for discussion: the relationship between the short axis fast line and the middle axis slow line, the relationship between the cloud band and price, and the position of the slow band, and finally combine all the parameters together.
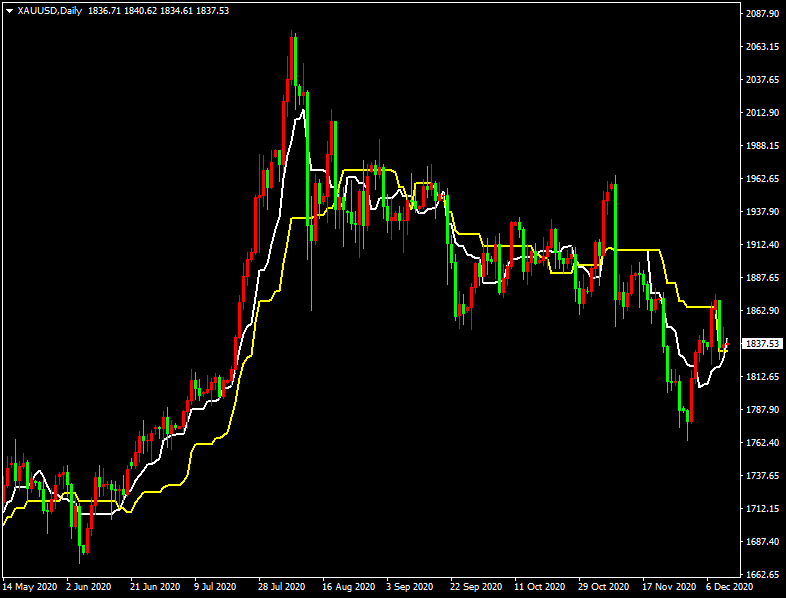
Figure 2: Ichimoku Kinko Hyo shows only the white conversion line (fast line) and the yellow baseline (slow line) on the daily gold chart
The relationship between the fast and slow lines of the Ichimoku Kinko Hyo is similar to the concept of the double moving average strategy, and is an important reference for judging momentum in actual operations. As shown in Figure 2, if the price is above the fast line and the fast line is above the slow line (golden cross), it means that the market has strong upward momentum; if the price is below the fast line and the fast line is below the slow line (death cross), it means that the market has strong downward momentum.
In actual operation, some people may question why not use the moving average instead of the fast and slow lines? Because the fast and slow lines are the middle price calculated from the highest price and the lowest price, when the trend reverses, if you want to set the stop loss and stop profit with the fast and slow lines or the moving average, the moving average will always change "smoothly" due to the statistical relationship of the formula, and the fast and slow lines will be relatively fixed in the absence of new highs and lows.
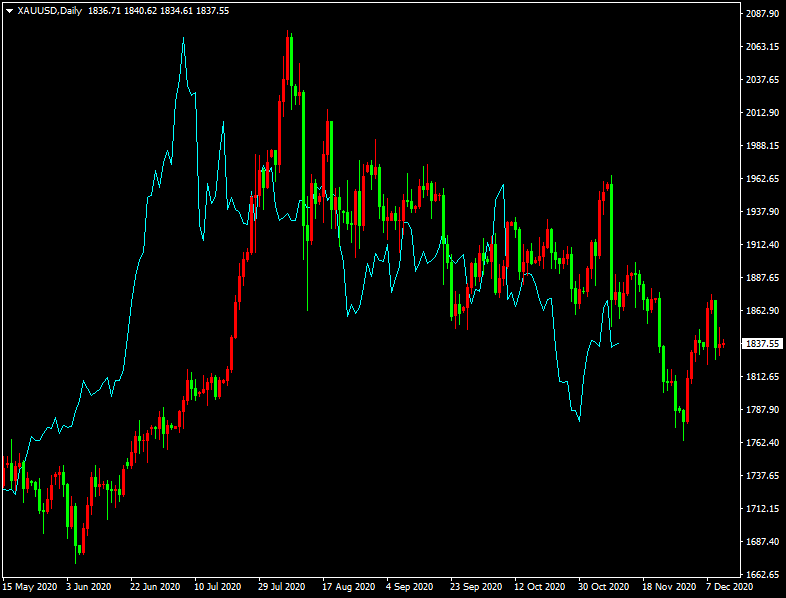
Figure 3: Ichimoku Kinko Hyo shows only the extension line (Chikan) on the daily gold chart, represented by the blue line
The extension line is to shift the current price to the past (left side) by 26 periods (common medium-term parameters). This is a direct comparison of the relative relationship between the current price and the price of the 26th period in the past. If the current price is higher than the price of the 26th period before, the extension line is above the price, which can be regarded as a bullish signal. On the contrary, if it is lower than the price of the 26th period before, the extension line is below the price, which is regarded as a bearish signal. In simple terms, the meaning of the extension line in the Ichimoku Kinko Hyo is to observe whether a rising trend or a falling trend appears or continues.
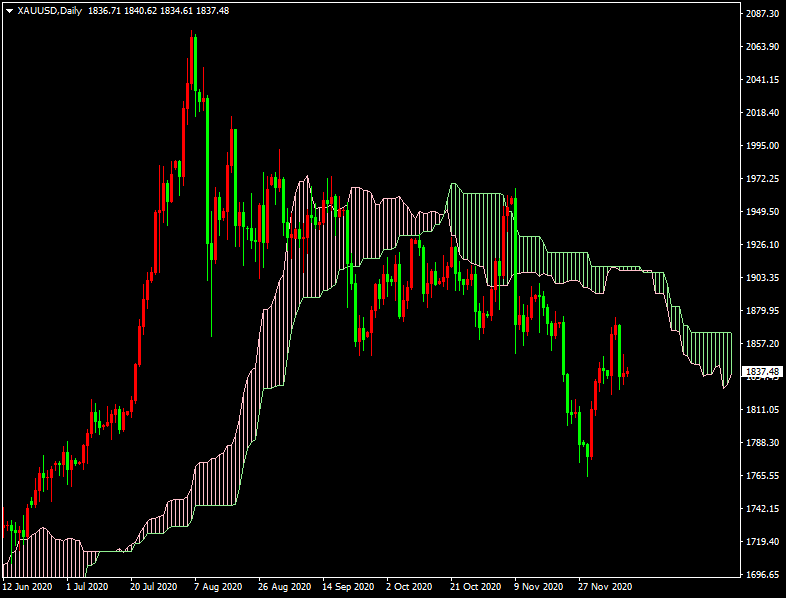
Figure 4: Ichimoku Kinko Hyo shows only cloud bands (layers) on the daily gold chart, with red representing ascending cloud bands and green representing descending cloud bands
The cloud band is the soul of the Ichimoku Kinko Hyo, which can quickly interpret the trend direction. The cloud band drawing will also calculate (move right) 26 periods into the future (a commonly used medium-term parameter), which can predict future support and pressure and is a good reference. The cloud band reminds traders whether the trend will reverse. When the price is above the cloud band, it is expected to be a bullish trend. If the price is below the cloud band, it is expected to be a bearish trend. The leading band A and leading band B mentioned in the previous article, if the leading band A> the leading band B, the cloud band is an ascending cloud band (white cloud), represented by red; if the leading band B> the leading band A, the cloud band is a descending cloud band (dark cloud), represented by green; when the color of the cloud band changes, it is mostly a signal of market reversal or long and short unclear entering consolidation. The thickness of the cloud band represents volatility. The thicker it is, the stronger the support or pressure of the cloud band. Therefore, when the price breaks through (falls below) the cloud band, it can be regarded as a signal of trend launch.
Figure 5: Ichimoku Kinko Hyo displayed normally on the daily gold chart
After explaining the parameters of the Ichimoku Kinko Hyo, we need to pay attention to the relative positions between the parameters, which will affect the strength of the signal given by a single parameter. For example, when the fast and slow lines have a golden cross, if they are above the cloud band, it represents a strong buy signal, in the cloud band, the strength is average, and below the cloud band, the signal strength is weak; when the fast and slow lines have a death cross, if they are below the cloud band, it represents a strong sell signal, in the cloud band, the strength is average, and above the cloud band, the signal strength is weak. Generally speaking, in practical operations, strong signals are more difficult to appear.
When the fast and slow lines are parallel or constantly intersecting and entangled, the cloud band becomes thinner or the color changes frequently, it will deepen the judgment that the future trend will fluctuate and consolidate. In addition, the extension line with the cloud band has another predictive effect, that is, when the extension line passes through the cloud band, it can be interpreted as a confirmation of the market, indicating that the trend will be maintained.
When the upward (downward) trend is obvious, the fast and slow lines will help users determine whether the momentum continues. If the price pulls back (rebounds) and crosses the fast line, it means that the momentum is gradually weakening. If it approaches the slow line or even crosses it, it represents a short-term market or reversal. Pay more attention to whether there are signals of long and short swaps.
In summary, bullish and bearish signals can be roughly divided into the following points. If more points are met, the trend will be more obvious. In practical application, we can adjust our entry position according to the signal strength.
Bullish signals:
The price (K-line) is above the cloud band, the cloud band is red (or changes from green to red), the extension line is bullish, and the fast and slow lines are golden crosses.
Bearish signal
The price (K-line) is below the cloud, the cloud is green (or changes from red to green), the extension line is bearish, and the fast and slow lines are deathly crossed.
How to set up Ichimoku Kinko Hyo on ST7?
After reading the above Ichimoku Kinko Hyo's parameters and signal interpretation, you should have a basic understanding of the usage of Ichimoku Kinko Hyo. So how do you set up the Ichimoku Kinko Hyo in ST7?
It is actually very simple. After entering the ST7 interface, in the chart where you want to add the Ichimoku Kinko Hyo, click Insert in the upper left corner, and then select Technical Indicators → Trend Indicators → Ichimoku Kinko Hyo.
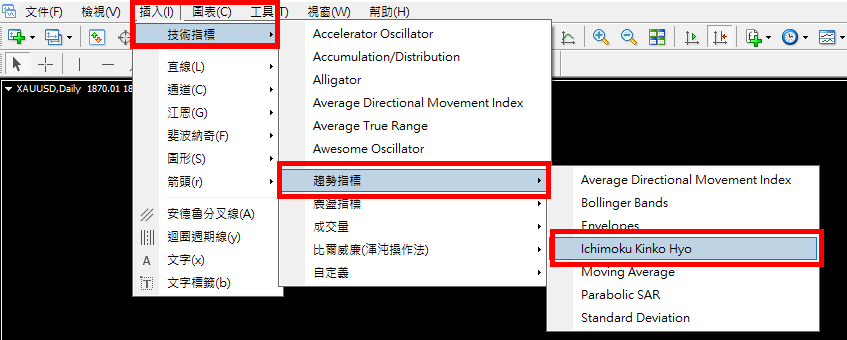
Figure 6: Enlarged view of the inserted technical indicator
After clicking Ichimoku Kinko Hyo, you will enter the parameter setting interface, which includes parameters, colors and application range. After the settings are completed, click OK to successfully insert the Ichimoku Kinko Hyo into the chart.
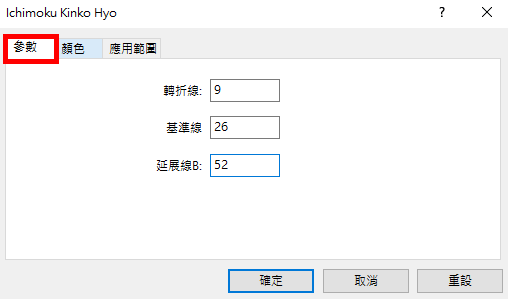
Figure 7: Ichimoku Kinko Hyo parameter settings, in the order of the short, medium and long time periods mentioned above
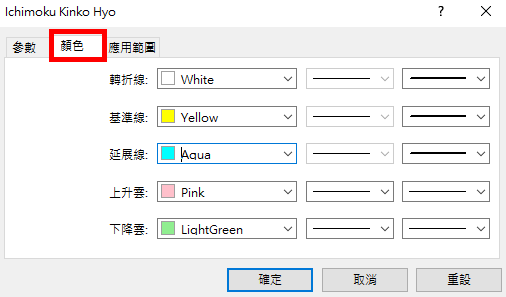
Figure 8: Ichimoku Hyōden color settings. Since there are many parameters, you can set the colors you are used to in order to quickly distinguish them.
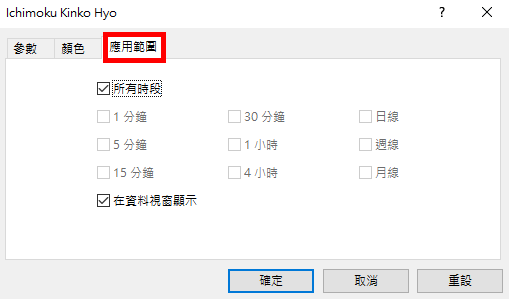
Figure 9: Applying the range setting can change the time level displayed by the technical indicator
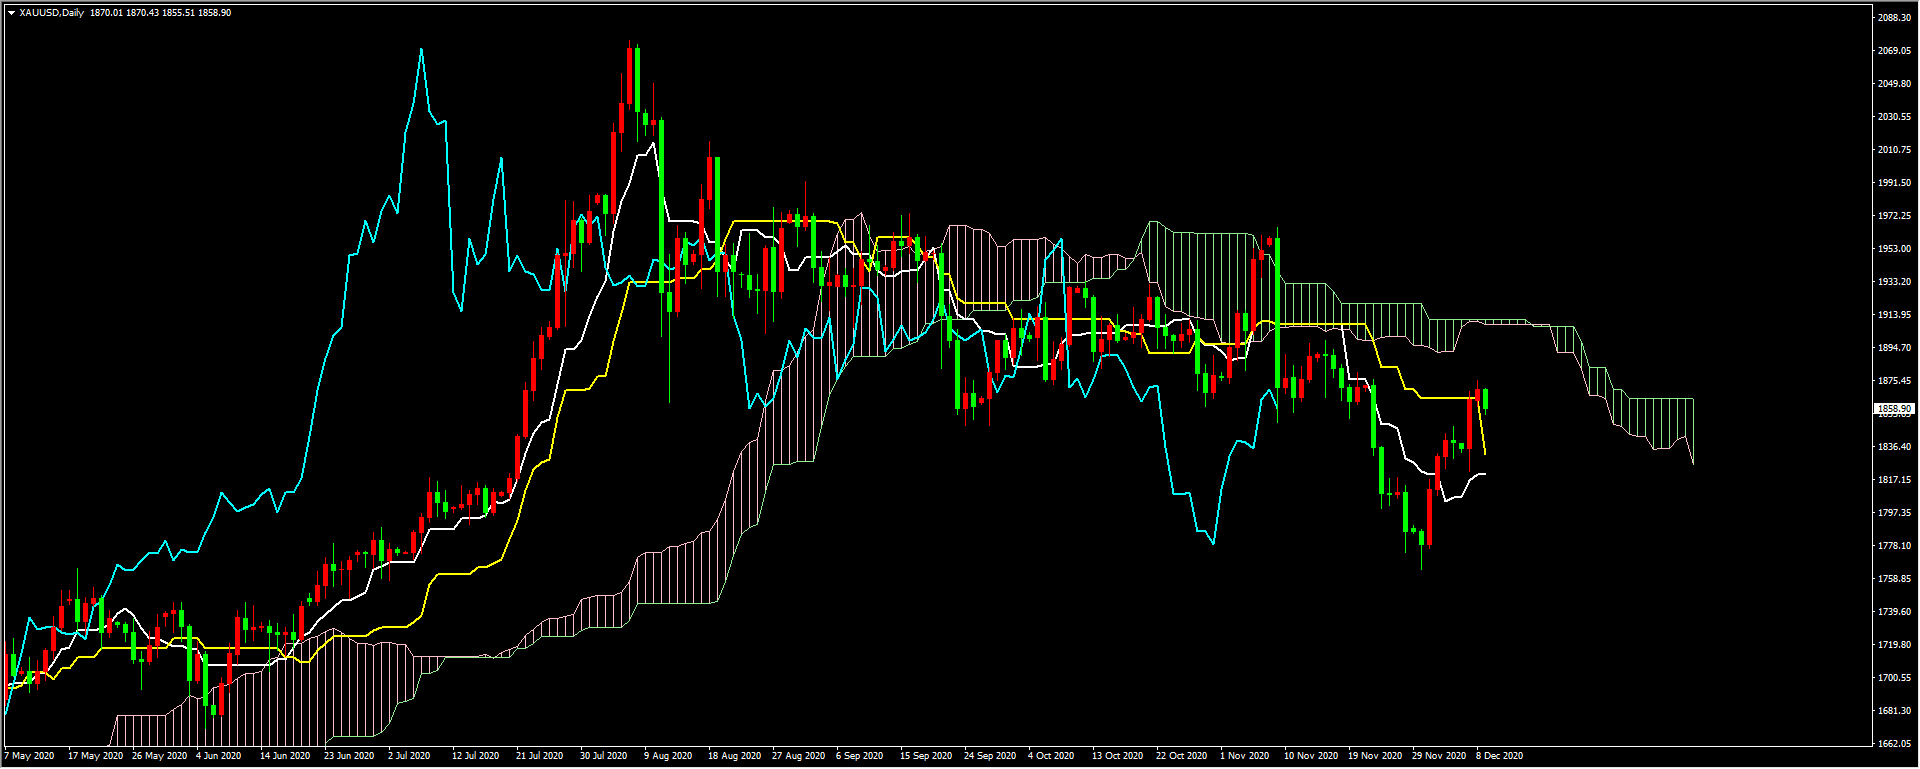
Figure 10: Ichimoku Kinko Hyo setting completed